03/02/2021
An international team of climatologists is studying how to minimise errors in observed climate trends
Experts in climatology from the Universitat Rovira i Virgili, the State Meteorology Agency and the University of Bonn (Germany) make headway in identifying the most reliable methods that help to correct these biases
Experts in climatology from the Universitat Rovira i Virgili, the State Meteorology Agency and the University of Bonn (Germany) make headway in identifying the most reliable methods that help to correct these biases
The instrumental climate record is the cultural heritage of humankind, the result of the diligent work of many generations of people all over the world. However, the changes in the way in which temperature is measured, as well as the environment in which weather stations are located can produce spurious trends. An international study carried out by researchers from the Universitat Rovira i Virgili (URV), the State Meteorology Agency and the University of Bonn (Germany) have succeeded in identifying the most reliable methods that help correct these trends. These “homogenization methods” are a key step in converting the enormous effort made by observers into reliable data about climate change. The results of this research, funded by the Spanish Ministry of Economy and Competitiveness, have been published in the Journal of Climate of the American Meteorological Society.
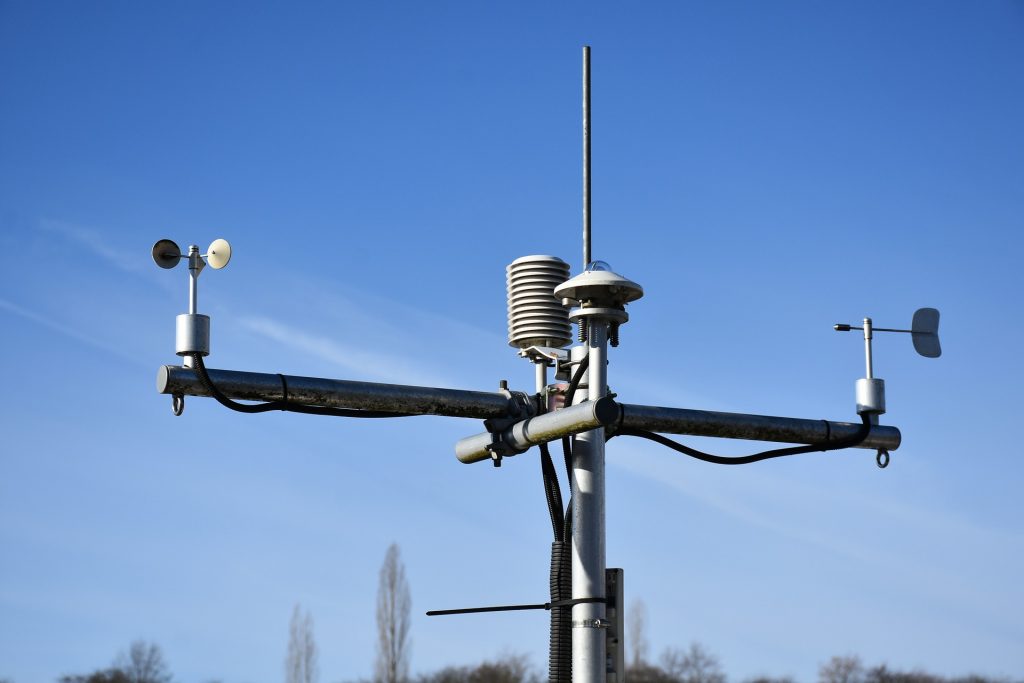
Climate observations can often be traced back more than a century, even before there were cars and electricity. These long periods of time mean that it is practically impossible to maintain the same measuring conditions over the years. The most common problem is the growth of cities around urban weather stations. We know that cities are getting warmer and warmer because of the thermal properties of urban surfaces and the reduction of evapotranspiration surfaces. To verify this, it is sufficient to compare urban stations with nearby rural stations. Although less known, similar problems are caused by the expansion of irrigated crops around observatories.
The other most common reason for biases in observed data is that weather stations have been relocated, among other reasons, because of changes in the observation networks. “A typical organisational change consisted of weather stations, which used to be in cities, being transferred to newly built airports which needed observations and predictions,” explains Victor Venema, a climatologist from Bonn and one of the authors of the study. “The weather station in Bonn used to be in a field in the village of Poppelsdorf, which is now a part of the city and, after it had been moved several times, it is now in the Cologne-Bonn airport,” he says.
As far as the robust estimation of global trends is concerned, the most important changes are technological, which are made simultaneously in an observation network. “At the moment we are in the middle of a period of generalised automation of the observation networks,” says Venema.
The computer programs that can be used for the automatic homogenisation of climate time series data are the result of several years of development. They operate by comparing stations that are near to each other and looking for changes that only take place in one of them, unlike climate changes, which affect them all.
To examine these homogenization methods, the research team generated a test bank in which they incorporated a set of simulated data that reliably imitated the sets of observed climate data, including the biases mentioned. Hence, the spurious changes are known and they can be studied to determine how the various homogenisation methods can correct them.
The test data sets generated were more diverse than those in previous studies and so were the real networks of stations, because of differences in how they were used. The researchers reproduced networks with highly varied densities of stations because in a dense network it is easier to identify a small spurious change in one station. The test data set that was used in this project was much larger than in previous studies (a total of 1,900 weather stations were analysed), which enabled the scientists to accurately determine the differences between the main automatic homogenisation methods developed by research groups in Europe and America. Because of the large size of the test data set, only the automated homogenisation methods could be tested.
The research group discovered that it is much more difficult to improve the estimated mean climate signal for an observation network than improve the accuracy of the time series of each station. In the resulting classification, the methods of homogenisation proposed by URV and AEMET were better than the others. The method developed at the URV’s C3 Centre for Climate Change (Vila-seca, Tarragona) by the Hungarian climatologist Peter Domonkos proved to be the best at homogenising both the series from individual stations and the mean series from the regional network. The AEMET method, developed by the researcher José A. Guijarro, was very close behind. The homogenisation method developed by the National Oceanic and Atmospheric Administration of the United States (NOAA) was best at detecting and minimising systematic errors in trends from many weather stations, especially when these biases were produced simultaneously and affected many stations on similar dates. This method was designed to homogenise data sets from stations the world over where the main concern is the reliable estimation of global trends.
The results of this study have demonstrated the value of large test data sets. “It is another reason why automatic homogenisation methods are important: they can be tested more easily and this helps in their development,” explains Peter Domonkos, who started his career as a meteorological observer and is now writing a book on the homogenisation of climate time series.
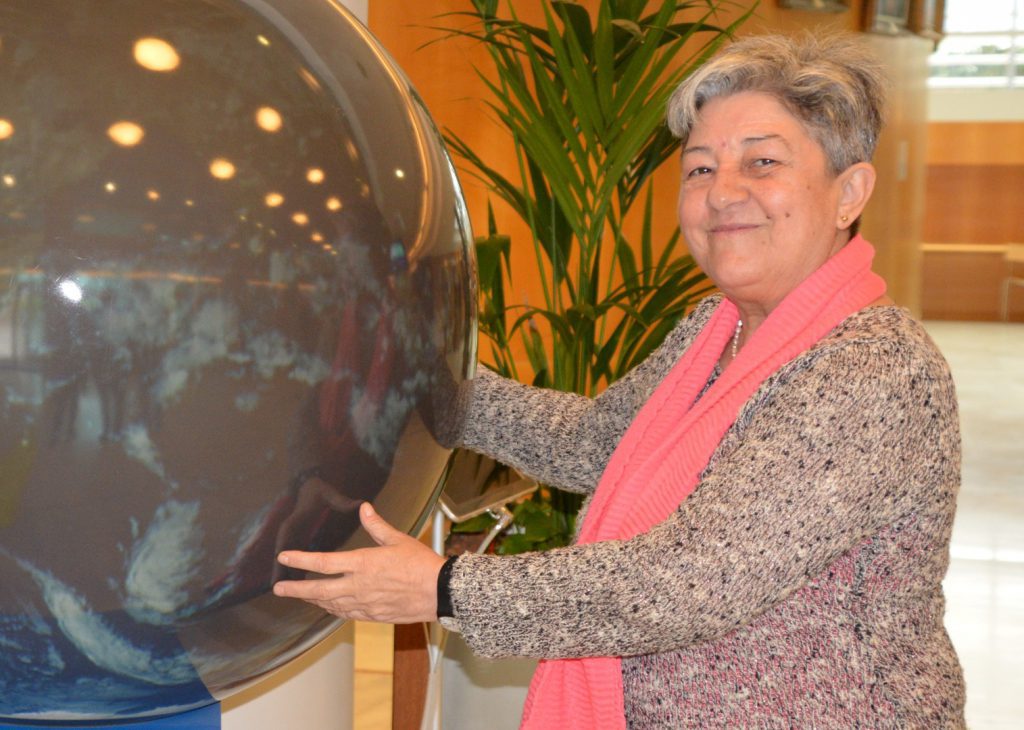
“The study shows the importance of very dense station networks in making homogenisation methods more robust and efficient and, therefore, in calculating observed trends more accurately,” says the researcher Manola Brunet, director of the URV’s C3, visiting member of the Climate Research Unit of the University of East Anglia, Norwich, United Kingdom, and vice-president of the World Meteorological Organisation’s Commission for Weather, Climate, Water and Related Environmental Services & Applications. “Unfortunately, much more climate data still has to be digitalised for even better homogenisation and quality control,” she concludes.

For his part, the researcher Javier Sigró, also from the C3, points out that homogenisation is often just the first step “that allows us to go to the archives and check what happened with those observations affected by spurious changes. Improving the methods of homogenisation means that we can do this much more efficiently.”
“The results of the project can help users to choose the method most suited to their needs and developers to improve their software because its strong and weak points are revealed. This will enable more improvement in the future,” says José A. Guijarro from the State Meteorology Agency of the Balearic Islands and co-author of the study.
Previous studies of a similar kind have shown that the homogenisation methods that were designed to detect multiple biases simultaneously were clearly better than those that identify artificial spurious changes one by one. “Curiously, our study did not confirm this. It may be more an issue of using methods that have been accurately fitted and tested,” says Victor Venema from the University of Bonn.
The experts are sure that the accuracy of the homogenisation methods will improve even more. “Nevertheless, we must not forget that climate observations that are spatially more dense and of high quality are the cornerstone of what we know about climate variability,” concludes Peter Domonkos.
Reference: Domonkos P, Guijarro JA, Venema V, Brunet M, Sigró J (2021): Efficiency of time series homogenization: method comparison with 12 monthly temperature test datasets. J. of Climate, 49 pp, DOI: 10.1175/JCLI-D-20-0611.1

More news about: Centre for Climate Change (C3)