19/03/2018
How is innovation measured?
by Àlex Fabregat Tomàs and Aleyois Haro Peralta

by Àlex Fabregat Tomàs and Aleyois Haro Peralta
Peter F. Drucker, “If you can’t measure it, you can’t improve it”
The widely recognized positive relationship between innovation, economic growth and competitiveness is key to developing systems for measuring the factors that influence innovation. Certainly, as the Oslo Manual identifies, companies’ innovative capacity is significantly affected by regional factors such as the presence of the universities, research institutes, technology and innovation centres, business clusters, private finance funds and initiatives to stimulate territorial growth. Therefore, it is crucial to be able to identify, measure and manage the main elements that foster innovative activity and the development of specific sectors at a regional level, so that public policies can be oriented towards innovation and entrepreneurship. In this regard, the European Commission’s Smart Specialisation Platform has drawn up the Guide on Research and Innovation Strategies for Smart Specialisation (RIS3) to help EU member states and regions to develop strategies for intelligent specialisation. The main goal is for regions to identify the areas of economic and knowledge-based specialisation best suited to their assets, capabilities and innovation potential.
Currently, the metrics used to evaluate innovation capacity in the EU are applied at regional level, which corresponds to level NUTS2 of the Union’s current criteria for territorial classification. In Spain, this corresponds to the autonomous communities, which represent the second tier of government. Under this classification, the autonomous community of Catalonia is one of the NUTS2 regions with more weight in demographic and macro-economic terms. Consequently, current studies have a fundamental limitation in that they fail to reflect the wide socio-economic variation within Catalonia. It is therefore essential to apply the criteria on a smaller scale (i.e. the NUTS3/provincial level) in order to develop regional policies that can maximize the growth potential of each region on the basis of its strengths and characteristics.
In this regard, by applying a system of indicators at the NUTS3 level, policy makers could (i) carry out analyses at regional level by increasing the amount of data obtained; (ii) measure the evolution and impact of innovation policies and (iii) carry out benchmarking exercises in order to identify regional strengths and weaknesses and good practices from other systems. Thus, the aim is to create a scoreboard to support decision-making regarding innovation and regional development in both the public and private spheres.
The Regional Innovation Scoreboard (RIS) is the accepted instrument for measuring the impact of innovation policies at regional, so the first step is to increase level of data in the analysis by applying the RIS indicators at NUTS3 level. The data used to compile RIS are derived from the European Commission’s main statistical database, Eurostat, which mostly draws on data obtained from each member state. The metrics applied to innovation by member states and Eurostat are obtained using input-output models that often have significant limitations when it comes to capturing the complex dynamics that determine the level of innovation in a given region. Recently, the databases have been complemented by composite indicators and indices designed to provide a more rigorous picture of the European innovation map.
Table 1 shows the source of the data at NUTS2 level and the availability of data at NUTS3 level for each of the 18 composite RIS indicators. As can be seen, there is no data available for estimating most of the indicators at the provincial level. This limitation to expanding RIS results to NUTS3 level raises two issues: (i) the availability of disaggregated data at provincial level and (ii) the reproducibility of the procedure for determining the composite indicator.
Regarding the first issue, the Community Innovation Survey (CIS) is conducted at NUTS2 level, as is the case with most surveys carried out within individual member states and across the EU as a whole. Typically, the disaggregation of provincial results does not satisfactorily increase the representativeness of the data. One possible solution is to correct the lack of representativeness at NUTS3 level by modifying the survey methodology and extending the territorial scope of the sample; however, this is almost unfeasible due to the high associated cost.
Table 1. Source of data at NUTS2 level (RIS) and availability of data at NUTS3 per composite indicator
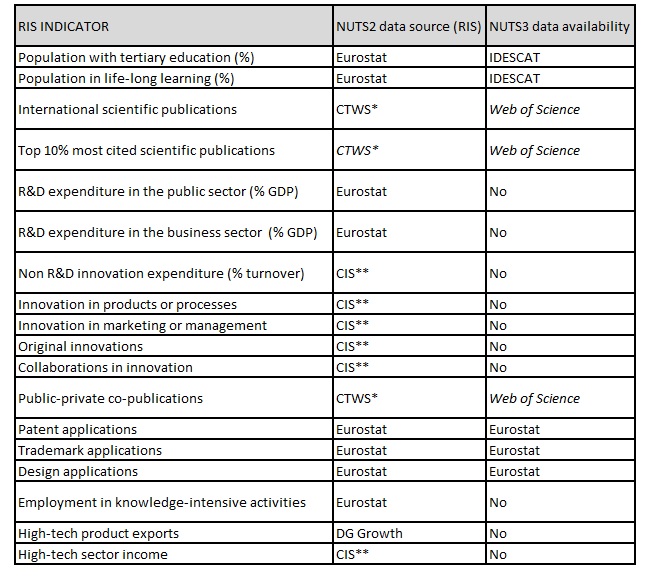
Regarding the second issue, reproducing the procedure to determine the composite indicator is limited by the fact that the application of some RIS indicators has been outsourced to other organizations. These shortcomings mean that it is impossible to apply the indicator at NUTS3 level.
To overcome these two limitations to determining some of the composite indicators at regional level, statistical learning tools can be used to construct a model to determine quantifiable relationships between the dependent variables (the indicators) and a set of independent variables in which some type of dependency is suspected.
Among the great variety of statistical learning tools available, the Multivariate Linear Model (MLR) is the most suitable option because it can identify the possible relationships between variables, is easy to interpret and can determine the specific weight of each of the independent variables. In fact, these tools have already been used in the RIS to determine the composite indicator revealed export advantages (RXA). Thus, the MLR has made it possible to investigate the dependence between RXA and 13 variables including, among others, the number of patents, the gross domestic product per capita, population density, etc.
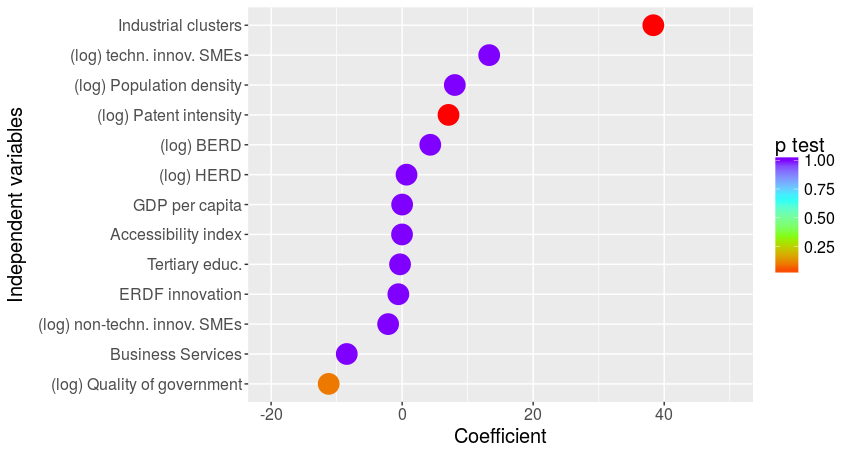
To give an example, the graph shows the value of linear coefficients for the 13 independent variables in the set of regions with medium technological specialization. The colour represents the degree of statistical confidence in the estimation of the coefficient (higher in red). These results indicate that for this particular sample of regions, RXA clearly depends on the number of industrial clusters and the ability to patent.
Figure 1. Coefficient values for the MLR of revealed export advantages
Another advantage of MLRs is that they allow predictions to be made about the behaviour of the dependent variable under other conditions in accordance with the proposed model.
These types of tool therefore offer the most appropriate strategy for estimating indicators not available at NUTS3 level. The main difficulty lies in finding the set of variables on which the indicator in question is clearly dependent. The answer to this problem consists of establishing a set of NUTS2 regions whose characteristics are very similar to those of Tarragona and “training” the MLRs to determine how the indicator in question depends on the chosen variables.
Finally, it should be added that the process of constructing a scoreboard is also hindered by the need to measure the impact of innovation in key areas of regional development such as culture, society, health and the environment.

More news about: Chair for the University and Knowledge Region