19/03/2018
Catalonia and Tarragona in Eurostat and other EU Databases
by Francesc Xavier Grau Vidal
by Francesc Xavier Grau Vidal
“You can’t improve what you can’t measure”. This has already become a common place, but it is intrinsically true. The idea has been stated in many different ways, probably most completely by H. James Harrington: “Measurement is the first step that leads to control and eventually to improvement. If you can’t measure something, you can’t understand it. If you can’t understand it, you can’t control it. If you can’t control it, you can’t improve it”. Clearly, any project that is intended to improve a system, region or country requires measurement and monitoring systems, systems for selecting representative statistics, and stable and coherent data. For this reason, the work conducted by Europe via Eurostat is so important since it provides regions and countries with a broad, coherent, stable and complete database with which to monitor their position and perhaps compare themselves to homologous entities. Comparison is not always odious and here it is essential because there are absolute bases for hardly anything. Only by comparing equals can one gauge one’s relative accomplishment in a particular field of activity.
Annex 1 [1] lists the 275 indicators by which Eurostat provides information about NUTS2 regions. Specifically, these include most of the important ones for monitoring the Europe 2020 objectives. Of these indicators, only 53 provide information about NUTS3 regions and this information is concentrated in several fields: the agro-environment, demography, economy, patents, company demography, transportation, disparity in employment rates, tourist establishments, and crime. They do not provide information about NUTS3 regions on such significant fields for society and the knowledge economy as education, R&D expenditure, employment (particularly employment in the high-technology sectors), human resources in science and technology, health, business structure, information and communications technologies, energy and the environment, agricultural holdings, or tourist activity. As we can see, the information on NUTS3 that is available from Eurostat is scant and incomplete and therefore insufficient for making any diagnosis or monitoring the development of a region by any parameters that define a society or knowledge economy.
The operational existence of a Knowledge Region can be defined when there exists, firstly, the capacity at regional level to design, agree and implement plans of action for developing a social and economic structure that is (more) based on knowledge and, secondly, the capacity to monitor and reformulate those plans. There is no doubt that this capacity exists in Catalonia as it does in the European NUTS2 regions. However, comparatively speaking, it is a huge waste of the potential of Catalonia and its regions that this capacity is limited to Catalonia as a whole when statistically (and culturally) Catalonia ought to develop the strategy of a country, just as countries of a similar or smaller size can (most EU countries, in fact).
In any case, no canonical definition of a Knowledge Region exists. Many initiatives around the world, and especially in Europe, have promoted instruments for enabling or boosting the development of these knowledge-based societies and economies. In the last few years both around the world and in Europe, additional elements of a social nature have been incorporated into the definition of this development and specifically into the definition of the innovation tools that make this development possible, with emerging concepts such as RRI (Responsible Research and Innovation) and Social Innovation. Indeed the Europe 2020 framework programme promotes RRI through, for example: RRI Tools, run by La Caixa; Irresistible; Great, which focuses on questions of governance; and the recently initiated HEIRRI (Higher Education Institutions and Responsible Research and Innovation), led by the UPF (Universitat Pompeu Fabra) and involving the participation of the rest of the Catalan public universities via GUNI-ACUP (The Global University Network for Innovation – Associació Catalana d’Universitats Públiques). With regard to social innovation, it is worth mentioning the Basque initiative RESINDEX (Regional Social Innovation Index), which is an index for measuring social innovation, and the publication A Blueprint for Social Innovation Metrics by Tepsie, another European project. In a wider context, also significant are the efforts made towards a quantitative definition of broader progress that covers social as well as economic aspects, such as Social Progress Imperative, a social progress index based on a range of social and environmental outcome indicators organised in three dimensions of social progress: Basic Human Needs, Foundations of Wellbeing, and Opportunity. As we can see, this is a vital element of development as a society, which finds its space for implementation in the regions.
The closest approximation today to a set of indicators for the knowledge society is the European Innovation Scoreboard. This annual report on innovation in the EU provides a set of indicators for the comparative evaluation of the performance in research and innovation of the EU member states as well as of the strengths and weaknesses of their research and innovation systems. The aim is to help member states evaluate areas they need to concentrate on in order to improve their performance in innovation, which is considered to be the foundation of the knowledge society.
The report is accompanied by a regional version, the Regional Innovation Scoreboard, whose fourth edition of Regional Innovation Indicators (2016) provides a comparative evaluation of the innovation results of 214 regions from 22 EU countries plus Norway (due to their size, Estonia, Cyprus, Latvia, Lithuania, Luxembourg and Malta are only included at the national level). Catalonia is, of course, one of these regions. One of the main points raised in the report is that every leader of regional innovation in the EU (36 regions) is located in just six countries: Germany, Denmark, Finland, France, the Netherlands, Sweden and the United Kingdom. This indicates that excellence in innovation today is concentrated in relatively few areas of Europe. The RIS3 projects must be able to extend innovative economic activity to other parts of Europe, including Catalonia. To do so more effectively and analogously to these leading countries, the strategy must be extended to the various Catalan regions which, like Tarragona, have sufficient potential as well as the means to do so.
Figure 1. Regions by performance in innovation
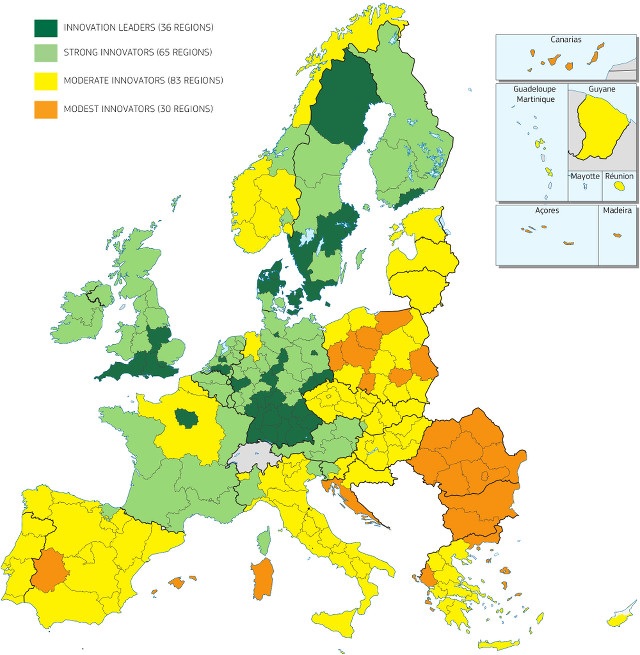
Figure 1 shows the distribution of the regions according to their performance as measured by innovation indicators. Clearly, the modest innovators and moderate innovators are concentrated in southern and Eastern Europe. Of all the countries in southern Europe, the Basque Country is the only region classed as having a strong performance in innovation. Innovation leaders are located in the more competitive EU countries. In this context, Catalonia appears to have lost ground in the last few years. No data are available for NUTS3 regions.
Figure 2. The 25 innovation indicators of the European Innovation Scoreboard. The indicators highlighted with a coloured circle are those used by the Regional Innovation Scoreboard
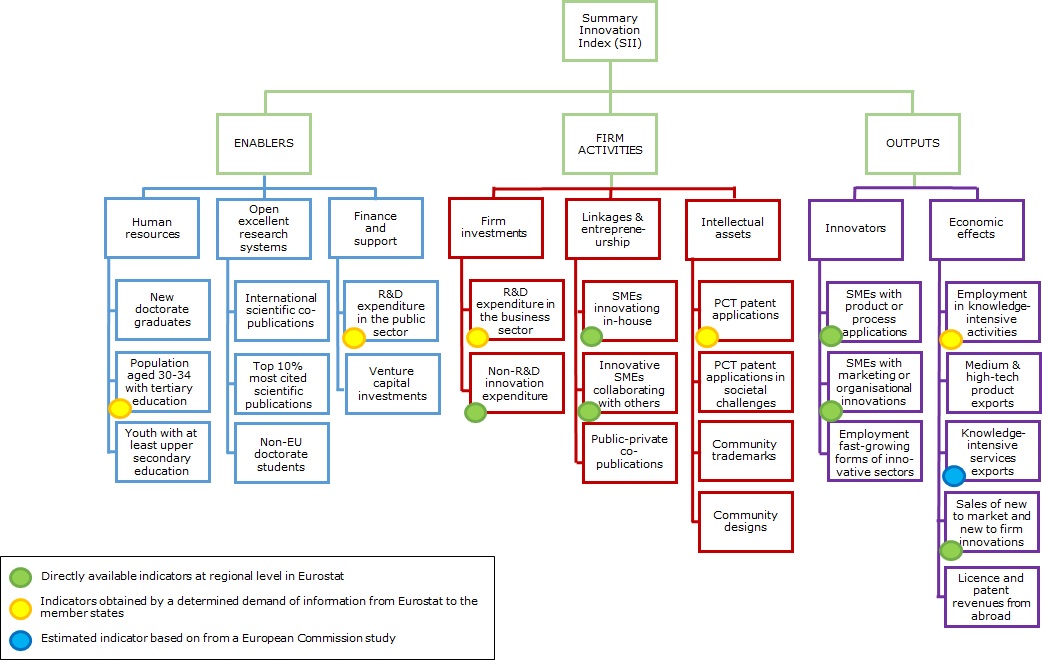
Figure 2 shows the 25 indicators used by the European Innovation Scoreboard for all countries of the European Union. Those highlighted with a coloured circle are the 12 indicators also available for regional evaluation. The yellow circles point to indicators that are directly available at the regional level from Eurostat. These are: population aged 30 – 34 with tertiary education; R&D expenditure in the public sector; R&D expenditure in the business sector; PCT patent applications (worldwide); and employment in knowledge – intensive activities. The blue circle points to an indicator for knowledge – intensive services exports, which is estimated from a European Commission study. Information for the remaining 6 indicators was obtained by way of a specific request for information from member states by Eurostat. These 12 indicators therefore represent the core of those that can be used to monitor the development of a region as a knowledge region and are only available at the NUTS2 classification level. It is hoped that Eurostat will continue compiling data in the future since the first four editions have helped to increase the volume of information.
The Regional Innovation Scoreboard 2016 report is accompanied by an annex for each country and an evaluation of the indicators for each region. It is interesting to discover what it says about Catalonia:
Catalonia is a Moderate Innovator. Innovation performance has declined (-7%) compared to two years ago. The radar graph shows that relative strengths compared to the EU-28 are in Tertiary education attainment, Employment in knowledge-intensive industries, and Exports of medium and high tech products. …Relative weaknesses are in Non-R&D innovation expenditures, Innovative SMEs collaborating with others, and SMEs with marketing or organizational innovations.
Figure 3. Evolution of the Innovation Index (left) for Catalonia and position of the indicators, according to the Regional Innovation Scoreboard (2016)
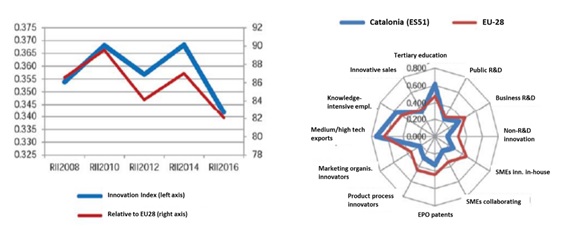
Figure 3 has been obtained directly from the above-mentioned annex. It shows the evolution of the global innovation index for Catalonia, which clearly indicates that Catalonia has lost ground compared to Europe as a whole. The figure also shows the set of 12 indicators analysed in a radar graph for easy visualisation of Catalonia’s relative position to the EU as a whole in each of these indicators.
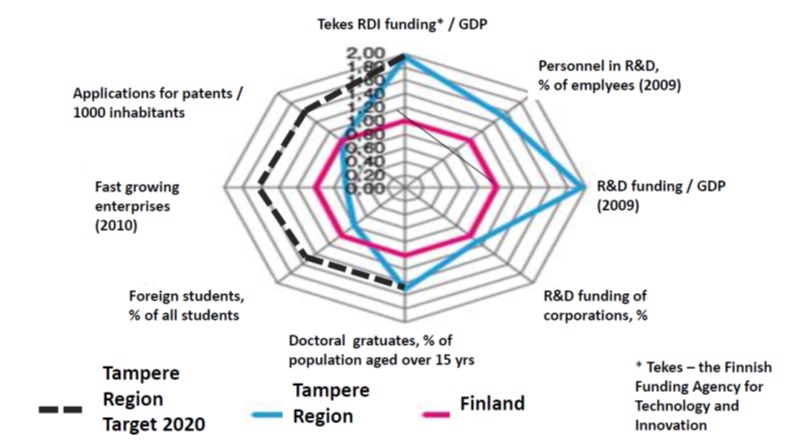
Any project aimed at developing the Tarragona region as a knowledge region in the operational sense described earlier, i.e. developing at the Southern Catalonia regional level, firstly the capacity to design, agree and implement plans of action for developing a social and economic structure that is (more) based on knowledge and, secondly, the capacity to monitor and reformulate those plans, will require obtaining data with the same level of quality and comparability as those provided by Eurostat and those used for the Regional Innovation Scoreboard. Ideally, other indicators with a social component should now be added, such as those proposed by RESINDEX (Regional Social Innovation Index) or the Social Progress Imperative. To analyse and monitor the position of the Tarragona region, however, the determining factor would be the ability to construct a graph like the one in Figure 3, just as the region of Tampere (Pirkanmaa, Finland) with a GDP of 17,435 million euros and 500,000 inhabitants has done, thus enabling them to set out their objectives graphically (see Figure 4).
Figure 4. Positioning and objectives of the region of Tampere by indicators of development and innovation. Tampere is a model for the Tarragona region.
Without reflecting on the current political framework, in which Catalonia is a Spanish autonomous community, there are several ways in which Southern Catalonia could achieve the status of a region. What may be considered the preferable route, and which would afford Southern Catalonia the status of a NUTS2 region – thus opening up opportunities and levels of information that are currently restricted to Catalonia – would be to modify the map of Spanish NUTS1 regions (essentially an administrative decision) and divide the current EST region (which, as the second of 117 EU regions and twice the recommended size for NUTS1 regions, is abnormally large as well as inoperative) into two similar-sized regions (of the maximum size envisaged for NUTS1 regions): NORD-EST (Catalonia) and EST (the Valencian Community and the Balearic Islands). This would enable NUTS2 regions to be defined within Catalonia with more appropriate dimensions for European NUTS2 regions. A second option would be similar to the one adopted for Finland: the current organisation system could be maintained but regional strategic development competences at the NUTS3 level could be transferred and activated by law, with the creation or operative identification of regional councils. This option would not solve the problem of the availability of NUTS2 classification data for these internal regions and the regional council itself would be responsible for collecting them, as does, for example, the Council for the region of Tampere.
For any of these or other options, a question remains regarding the definition of the expansion of the region. The current Tarragona NUTS3 region exactly matches the Spanish division of the territory into provinces. However, Catalonia has applied a moratorium on its Law of Vegueries and therefore still has to consolidate its own internal division. Clearly, this is not a minor or a technical matter, but introducing applicability criteria for regional policies based on smart specialisation through research and innovation in the new Europe 2020 framework could help provide a better operative definition that should also take into account the historical relationships between territories.
Main conclusions from section
- The operational existence of a Knowledge Region can be defined when there exists, firstly, the capacity at regional level to design, agree and implement plans of action for developing a social and economic structure that is (more) based on knowledge and, secondly, the capacity to monitor and reformulate those plans.
- Eurostat provides information in the NUTS2 classification about 275 indicators. These include most of the important ones for monitoring the Europe 2020 objectives. Of these indicators, only 53 provide information about NUTS3 regions and they do so only in certain fields. They do not provide information about NUTS3 regions on such significant fields for society and the knowledge economy as education, R&D expenditure, employment (particularly employment in the high-technology sectors), human resources in science and technology, health, business structure, information and communications technologies, energy and the environment, agricultural holdings, or tourist activity.
- The Regional Innovation Scoreboard monitors the innovation performance of over 200 European NUTS2 regions using 12 of the 25 indicators that are used to monitor the performance of the countries. Catalonia has lost ground in the last few years (falling from 89% of the EU average in 2010 to 82%).
- Developing the Tarragona region as a knowledge region will require the availability of data with the same level of quality and comparability as those provided by Eurostat and those used for the Regional Innovation Scoreboard.
- The best option would be to enable Southern Catalonia to achieve NUTS2 classification status by modifying the map of the Spanish NUTS1 regions. This would involve dividing the current EAST region into two – NORTH-EAST (Catalonia) and EAST (the Valencian Community and the Balearic Islands) – and defining NUTS2 regions inside Catalonia with dimensions that are appropriate for European NUTS2 regions. Alternatively, the current organisation system could be maintained but regional strategic development competences at the NUTS3 level could be transferred and activated by law through the creation or operative identification of regional councils.
- Introducing applicability criteria for regional policies based on smart specialisation through research and innovation could, in the new Europe 2020 framework, help to provide a better operative definition of regional organisation in Catalonia. This regional organisation should also take into account the historical relationships between territories.
Francesc Xavier Grau Director of the Chair for University and Knowledge Region URV
For further information on this topic, please see the document: GRAU, F.X., Southern Catalonia, Knowledge Region, Publicacions URV, 2016.
_____

More news about: Chair for the University and Knowledge Region